b2blistings.orgTHE most thorough website review service for B2B companies★ Get your own unique FAQ + Selling Points on your profile page★ be seen by 1000s of daily visitors and win new business
scichart.com
With over two twousand happy clients SciChart is a WPF Charts component that is being widely used by developers and companies who need to create high performance WPF Charts out of big data lumps in a fast manner. SciChart manages to assist developers in doing so by selling their fifteen thousands lines of code product The SciChart website does not stop there but is also including a vast amount of information regarding WPF Charts, advices, do`s and don`ts, trainings and many more. Once the product license is purchased users will also receive a one year's support from the SciChart developing team free of charge.Their technical team has successfully handled thousands of issues from customers accross many industries and sectors.
1. What makes SciChart the best choice for developers?
SciChart is the best choice for developers because it offers high-performance chart libraries built specifically for big data and complex applications. It supports all major Typescript, React, Vue, Angular, and more, using WebAssembly and WebGL for incredible performance. Whether you need charts for native Windows apps, iOS and macOS apps, or Android apps, SciChart has you covered. With support for DirectX11, .netCore or .Net Framework, Metal hardware acceleration, and GPU acceleration for Android, SciChart provides developers with the tools they need to create visually stunning and responsive charts.
2. How does SciChart compare to open-source charting solutions?
SciChart outperforms open-source charting solutions in terms of performance, features, and support. While open-source solutions may be free, they often lack the performance capabilities required for handling big data and complex applications. SciChart, on the other hand, utilizes advanced technologies like WebAssembly, WebGL, DirectX11, and GPU acceleration to deliver unmatched performance. Additionally, SciChart offers world-class tech support, ensuring that developers receive timely assistance and guidance when using their chart libraries.
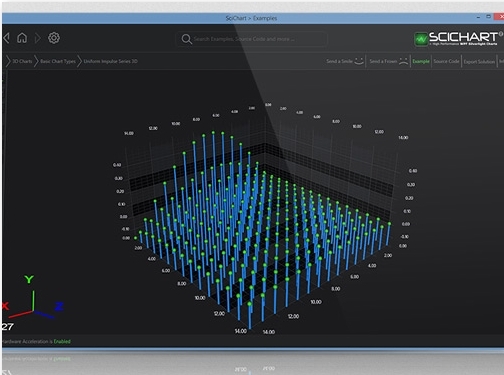
3. What are the best WPF charts offered by SciChart?
SciChart offers a range of WPF charts that cater to different needs. Some of the best WPF charts provided by SciChart include 2D charts, 3D charts, and trading charts. The 2D charts are ideal for visualizing data in a traditional x-y plot, while the 3D charts allow for the representation of data in a three-dimensional space. The trading charts, on the other hand, are specifically designed for financial applications and provide features like candlestick charts, volume profiles, and more. These charts are highly customizable and offer excellent performance.
4. What platforms are supported by SciChart for charting?
SciChart supports a wide range of platforms for charting. These include WPF (Windows Presentation Foundation) for native Windows apps, iOS and macOS for native apps on Apple devices, and Android for native apps on Android devices. Whether you are developing applications for Windows, iOS, or Android, SciChart provides charting solutions tailored to each platform. This allows developers to create visually appealing and interactive charts that seamlessly integrate with their target platforms.
5. Does SciChart offer expert services and customization options?
Yes, SciChart offers expert services and customization options for customers who require additional assistance or specialized charting solutions. Their team of data-visualization and charting experts can help accelerate your progress by providing guidance, customizations, and tailored solutions to meet your specific requirements. Whether you need assistance with integrating SciChart into your application, optimizing performance, or creating custom chart types, their experts are available to support you throughout the development process.
Some reasons to choose scichart.com
Flexibility of Features Testimonials
SciChart is a powerful, rich and feature complete charting library. Customers have praised the flexibility and features of the charts provided by SciChart.
Sander G.
According to Sander G., SciChart is flexible and reliable, providing the exact component they need. They were able to customize the look and feel of the graphs to their desired extremes, thanks to SciChart's flexibility. Additionally, the support provided by SciChart is fast and helpful, with useful answers usually received within a day. For more complex requests, SciChart works closely with the customer to ensure it is resolved.
Dan W.
Dan W. highlights that SciChart's product is very fast and flexible, allowing for efficient charting.
UK (London) based business - established in 2010 - providing a 2D and 3D Windows Presentation Foundation (WPF) charts component for developers. Website includes details of products provided, client list, testimonials, "meet the team" details, pricing, FAQs, regularly updated blog/news section, full contact details including company registration and VAT numbers. Company website has been online since 2012 according to web.archive.org.
b2blistings.org reviewer Signals of trust found on website
Testimonials found
Client list found
Full company contact address and
phone number found
 scichart.com
With over two twousand happy clients SciChart is a WPF Charts component that is being widely used by developers and companies who need to create high performance WPF Charts out of big data lumps in a fast manner. SciChart manages to assist developers in doing so by selling their fifteen thousands lines of code product The SciChart website does not stop there but is also including a vast amount of information regarding WPF Charts, advices, do`s and don`ts, trainings and many more. Once the product license is purchased users will also receive a one year's support from the SciChart developing team free of charge.Their technical team has successfully handled thousands of issues from customers accross many industries and sectors.
scichart.com
With over two twousand happy clients SciChart is a WPF Charts component that is being widely used by developers and companies who need to create high performance WPF Charts out of big data lumps in a fast manner. SciChart manages to assist developers in doing so by selling their fifteen thousands lines of code product The SciChart website does not stop there but is also including a vast amount of information regarding WPF Charts, advices, do`s and don`ts, trainings and many more. Once the product license is purchased users will also receive a one year's support from the SciChart developing team free of charge.Their technical team has successfully handled thousands of issues from customers accross many industries and sectors.
 b2blistings.org reviewer